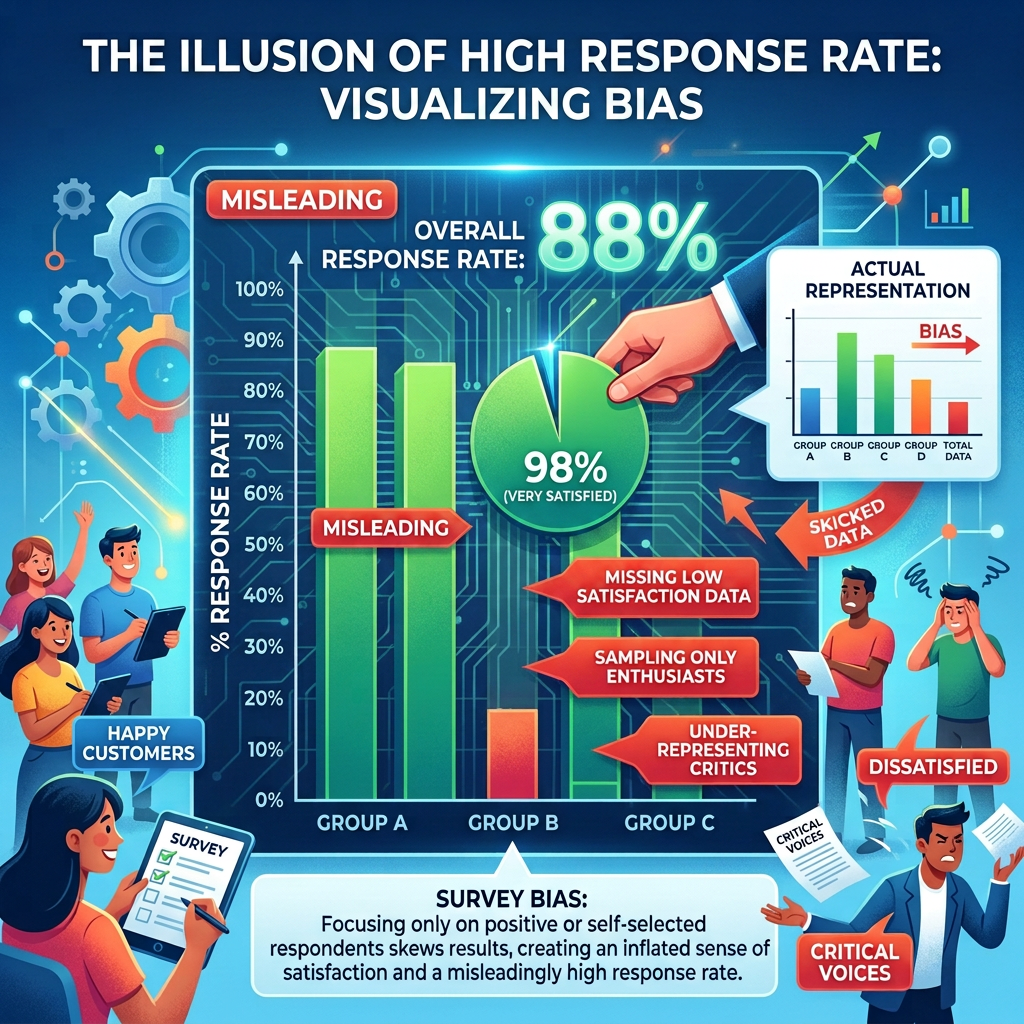
The first question people ask about a survey is almost always the response rate. Sponsors set targets for it, reviewers judge studies by it, and a low one is often treated as a fatal flaw. The instinct feels unimpeachable: surely the more people who answer, the closer you are to the truth. But the response rate is a surprisingly weak guide to whether a survey is biased, and treating it as the grade leads people to trust the wrong surveys and dismiss the right ones.
Start with what actually produces nonresponse bias. It is not the number of nonrespondents on its own. It is the combination of two things: how large the nonresponse is, and how different the people who did not answer are from the people who did, on the specific quantity you are estimating. Roughly, the bias is the nonresponse rate multiplied by that difference. So if the people you failed to reach are, on the variable in question, just like the people you reached, a high nonresponse rate costs you almost nothing; and if the missing people are systematically different, even a modest nonresponse rate can produce a large bias.
Because the response rate captures only one of those two factors, and misses the one that often matters more, it cannot by itself tell you how biased a survey is. Robert Groves and Emilia Peytcheva assembled fifty-nine studies in which the true values were known, so the real nonresponse bias could be measured, and they found very little correlation between the response rate and the bias. Surveys with low response rates were sometimes nearly unbiased; surveys with high response rates were sometimes badly biased. The number everyone treats as the quality grade barely tracked the quality, and pushing a response rate higher did not reliably shrink the bias.
There is a subtler point underneath. Nonresponse bias is not a property of a survey; it is a property of each estimate within the survey. The same survey can be nearly unbiased for one question and badly biased for another, because who is missing matters differently depending on what you measure. A health survey that quietly loses the sickest people can be badly biased on health status while remaining almost unbiased on commute times. So a claim that the survey as a whole has low bias is not even well formed; bias lives at the level of the number, not the instrument.
If the response rate is not the answer, what is? The question that matters is whether nonresponse is related to what you are measuring, which is the missing-data logic from earlier in this series, the difference between data missing at random and data missing for reasons tied to the outcome. In practice that means comparing respondents to known population benchmarks, using whatever frame or administrative information you have to see how respondents and nonrespondents differ, and where you can, following up a subsample of nonrespondents to measure the difference directly rather than assume it away. And it means reporting the risk of bias estimate by estimate, not as one response rate stamped on the whole survey.
None of this makes the response rate worthless. A higher rate shrinks the multiplier, so it buys some protection against the worst case, and a very low rate leaves more room for trouble if the difference turns out to be large. The honest framing is that the response rate is a bound on the risk, not a measurement of the bias: it tells you how much room there is for a problem, not whether you have one. So clearing a federal response-rate threshold is worth doing, but it is not the same as solving the bias problem, and missing it does not automatically make a survey worthless.
So here is my question for the group. When you judge a survey, do you stop at the response rate, or do you ask whether the people who are missing differ on the very thing you are trying to measure?


Leave a comment