Category: Uncategorized
-
A child reads at the 60th percentile. An applicant scores 110 on an aptitude scale. A patient lands in the average range on a cognitive screen. These numbers feel like objective readings, the way a thermometer reports a temperature. They are not. Each one is a statement about where the person stands relative to a…
-
For years, observational studies found that vaccinated seniors were about half as likely to die over the winter as unvaccinated ones. Taken at face value, that would make the flu shot one of the most powerful life-extending interventions in medicine, cutting deaths from every cause in half. It is not. The giveaway came from looking…
-

Try a quick test. Pick ten quantities you cannot know off the top of your head, the length of the Nile, the year a certain invention appeared, the population of a country, and for each give a low and a high value wide enough that you are 90 percent sure the truth falls between them.…
-
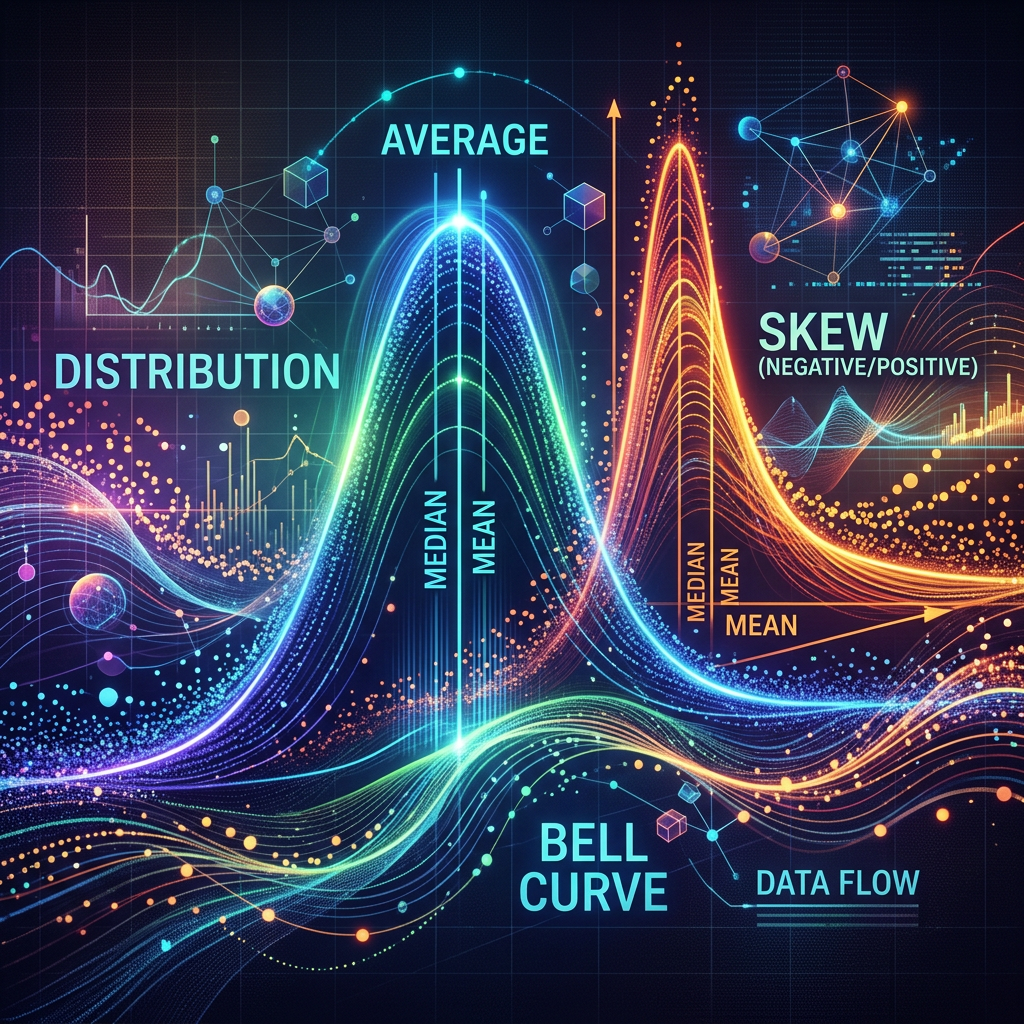
In the late 1940s, United States Air Force jets were crashing with alarming frequency, and no mechanical fault could be found. Attention turned to the cockpit, which had been designed decades earlier to fit the average pilot. A young researcher named Gilbert Daniels was asked to help update that average; however, he arrived with a…
-

We rarely measure the thing we actually care about. Durable employment, real learning, long-term health, and safety are slow to arrive, costly to observe, and hard to pin on any one program. So we measure a proxy that is faster and cheaper, a job placement, a test score, a lab value, and we treat movement…
-

A large share of the data we collect asks people to remember. How many times did you see a doctor last year? How much did you drink last month? When did the symptoms start? Since the program ended, have you found work? We treat the answers as records of what happened. They are not records.…
-

A common and well-meant step in qualitative research is to take your findings back to the people who gave you the data and ask, does this ring true? It feels like the ultimate check. Who better to confirm an interpretation than the people it is about? This is member checking, also called respondent or participant…
-
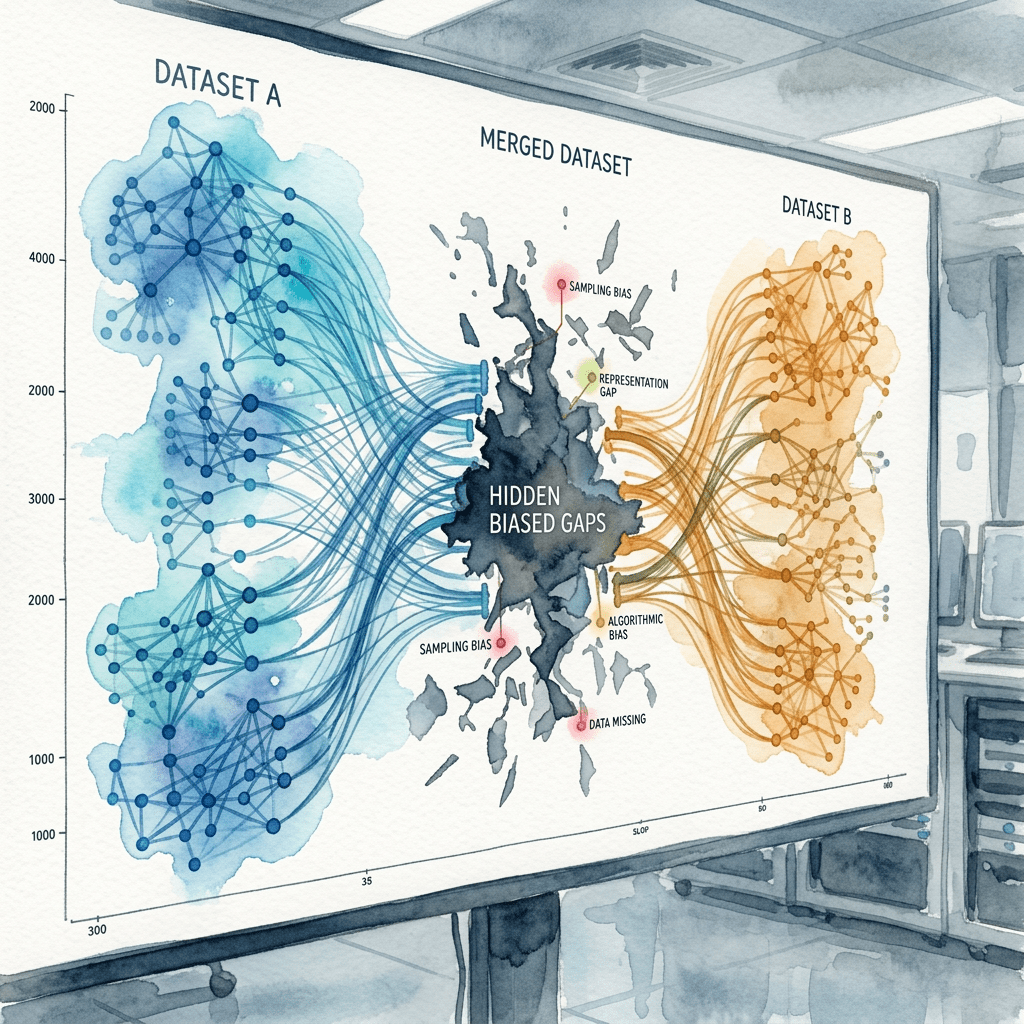
A great deal of modern research and evaluation runs on linked data. We connect a program’s enrollment file to earnings records, a survey to health claims, a benefits roster to death records, and suddenly we can follow people across systems we could never afford to track ourselves. The catch is in the joining. When two…
-
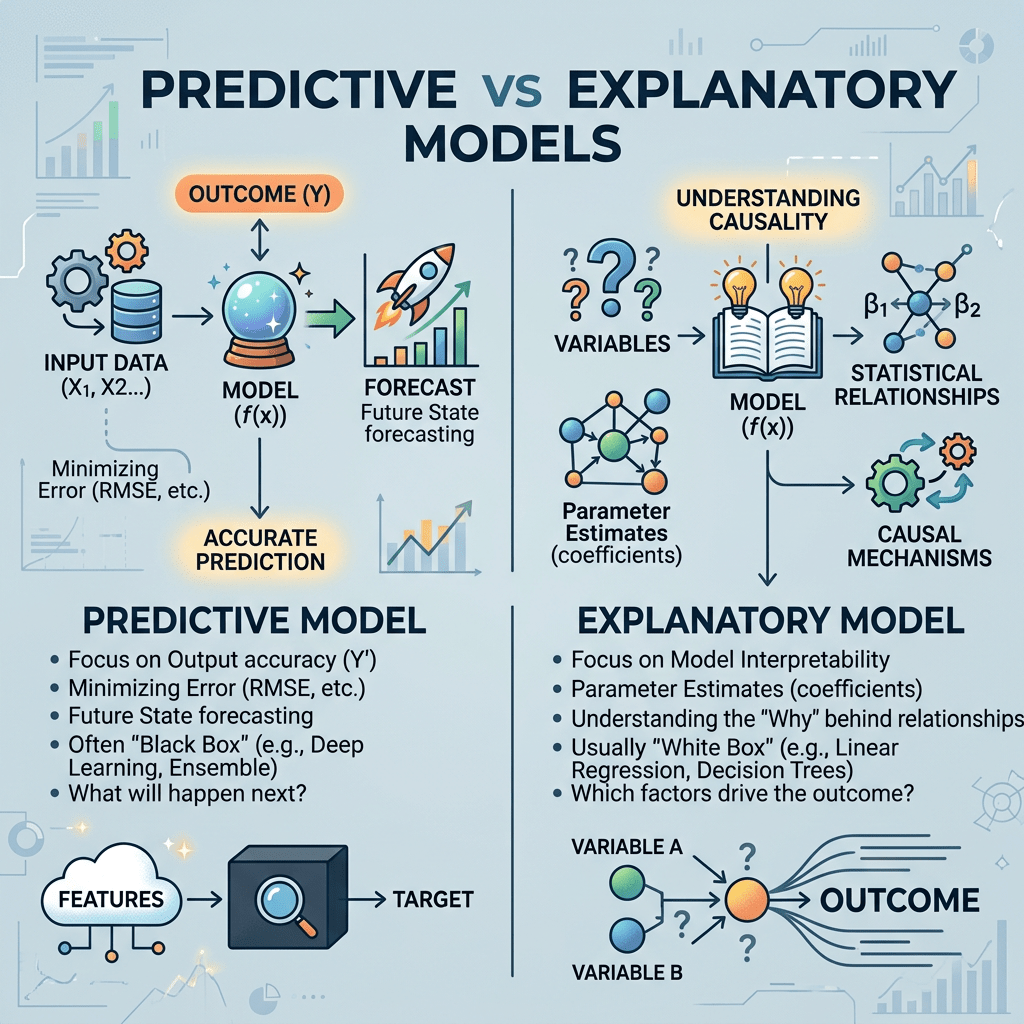
Two questions sound almost the same and are not. One is: what will happen? The other is: why does it happen, and what should we change? A model can be excellent at the first and useless at the second, and confusing them is one of the most common and costly mistakes in applied analysis. It…
-
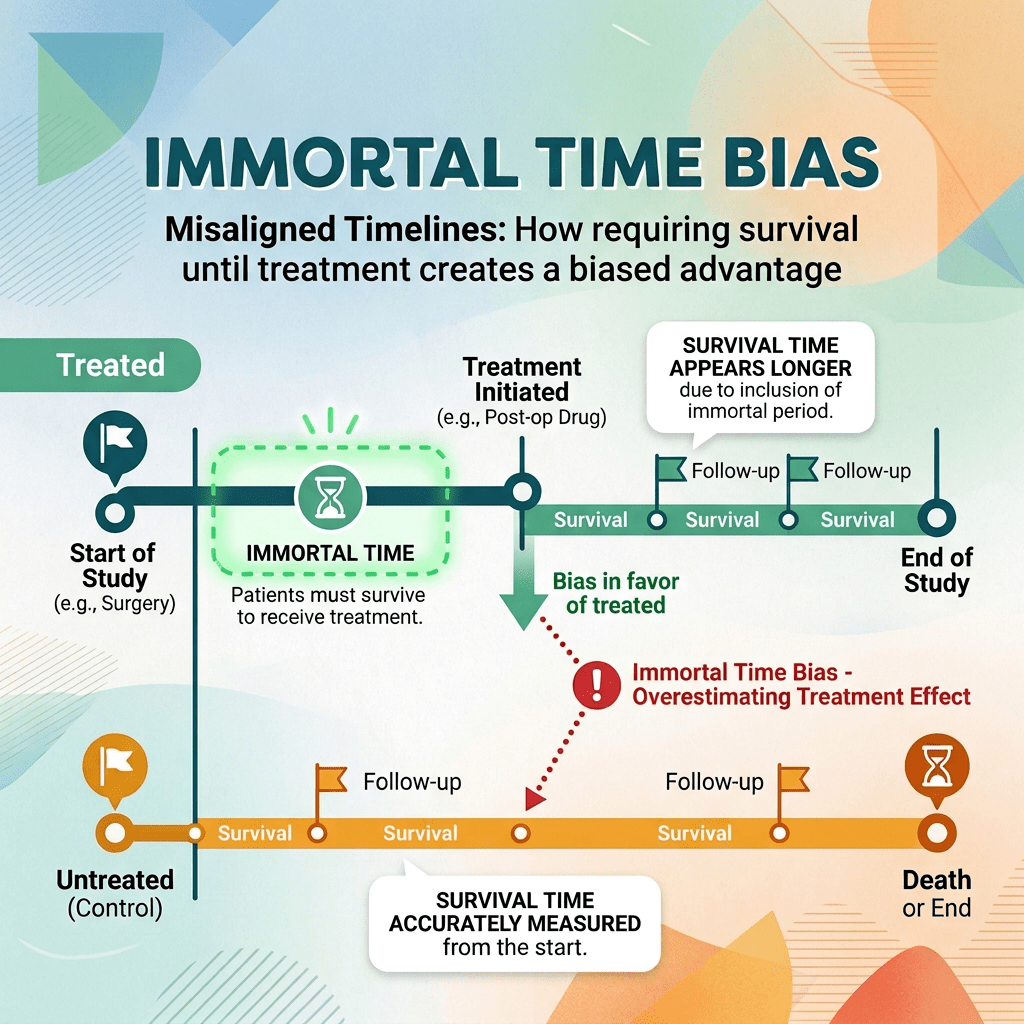
Observational studies keep discovering that people who did a certain thing live longer. Patients who filled their prescriptions outlive those who did not. Heart transplant recipients outlive those on the waiting list. Oscar winners outlive the nominees who lost. Some of these gaps are real. Many are an illusion produced by a single, subtle flaw…
-
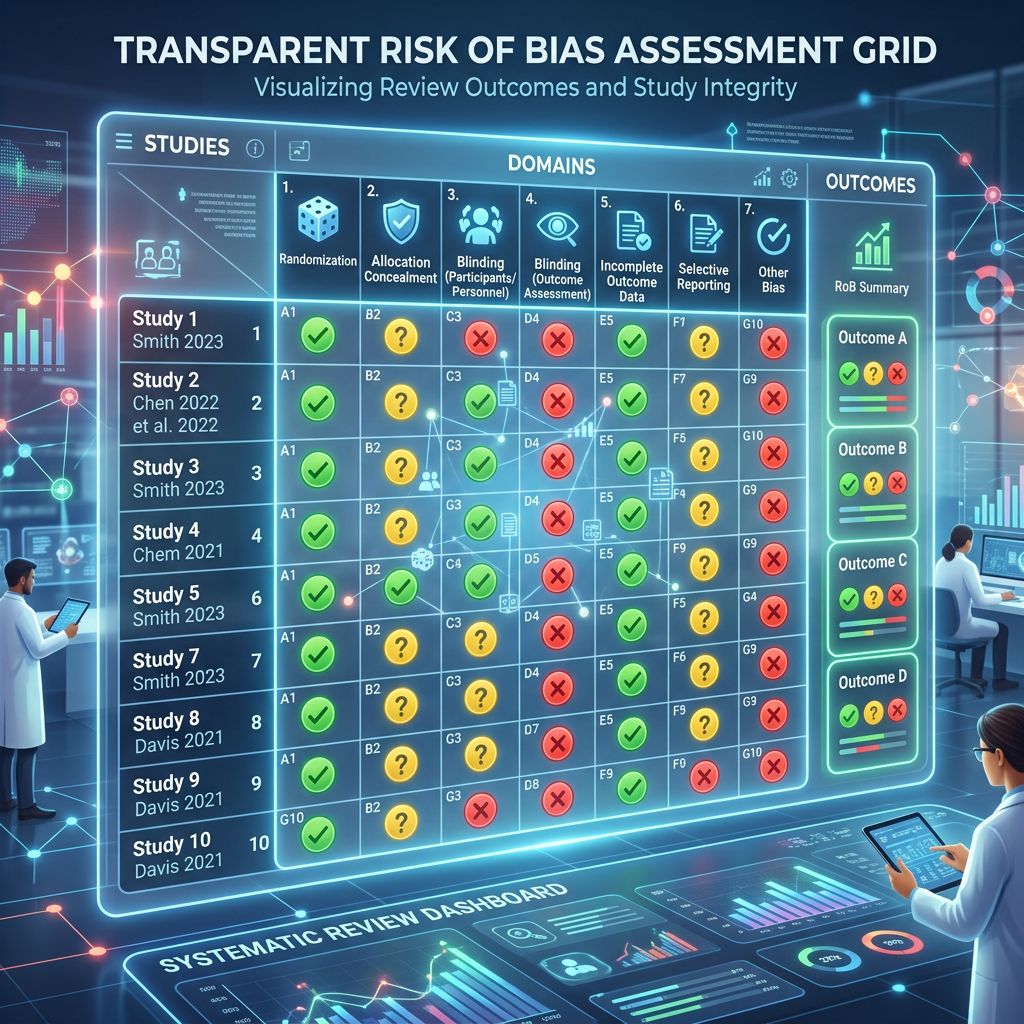
Its companion post argued that a single quality score is unreliable and often invalid, and that bias is not one property of a study but something specific to a mechanism and an outcome. That is the diagnosis. The repair is not a better scale. It is a different way of working, one that treats appraisal…
-

Every systematic review rests on a step that rarely gets questioned: appraising the quality, or the risk of bias, of each study it includes. To do that, reviewers reach for an appraisal tool, a checklist or a scale. What almost no one asks is whether the tool itself is any good. An appraisal tool is…
-
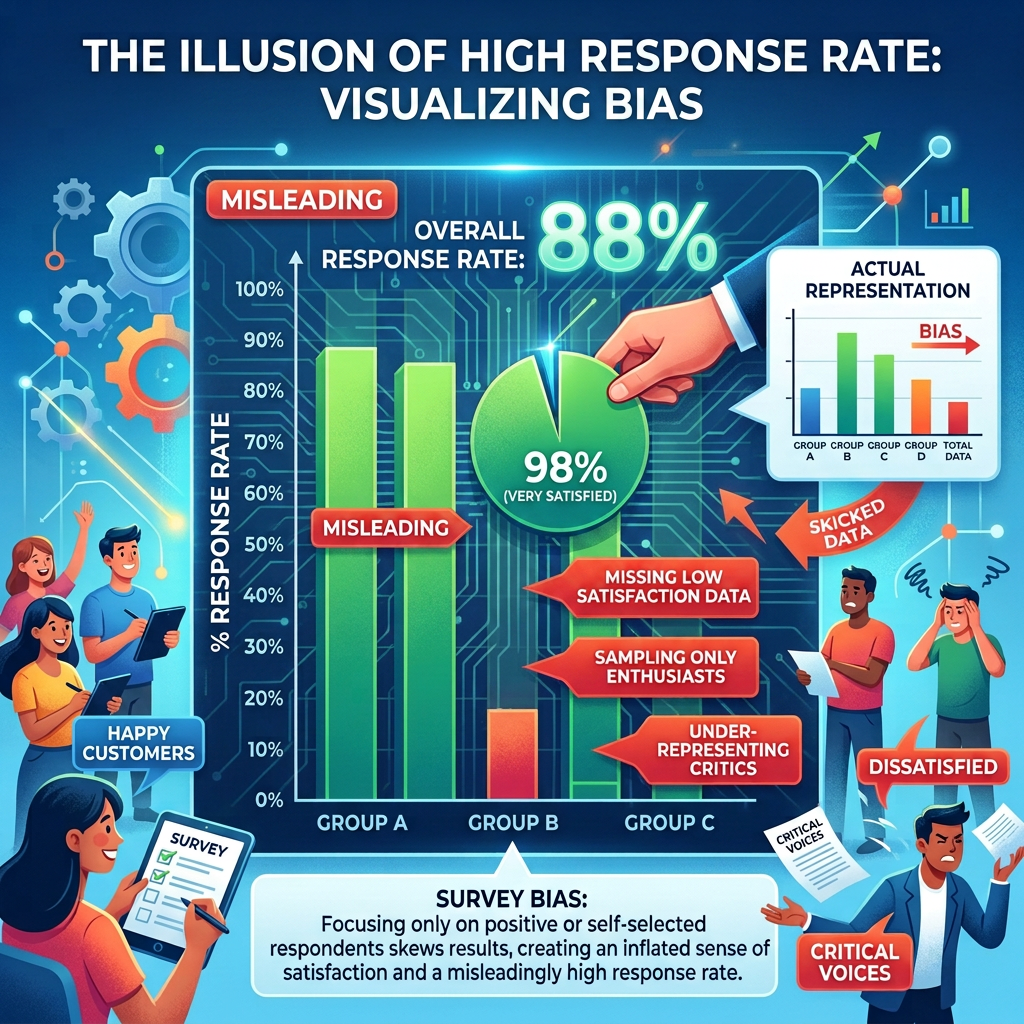
The first question people ask about a survey is almost always the response rate. Sponsors set targets for it, reviewers judge studies by it, and a low one is often treated as a fatal flaw. The instinct feels unimpeachable: surely the more people who answer, the closer you are to the truth. But the response…
-
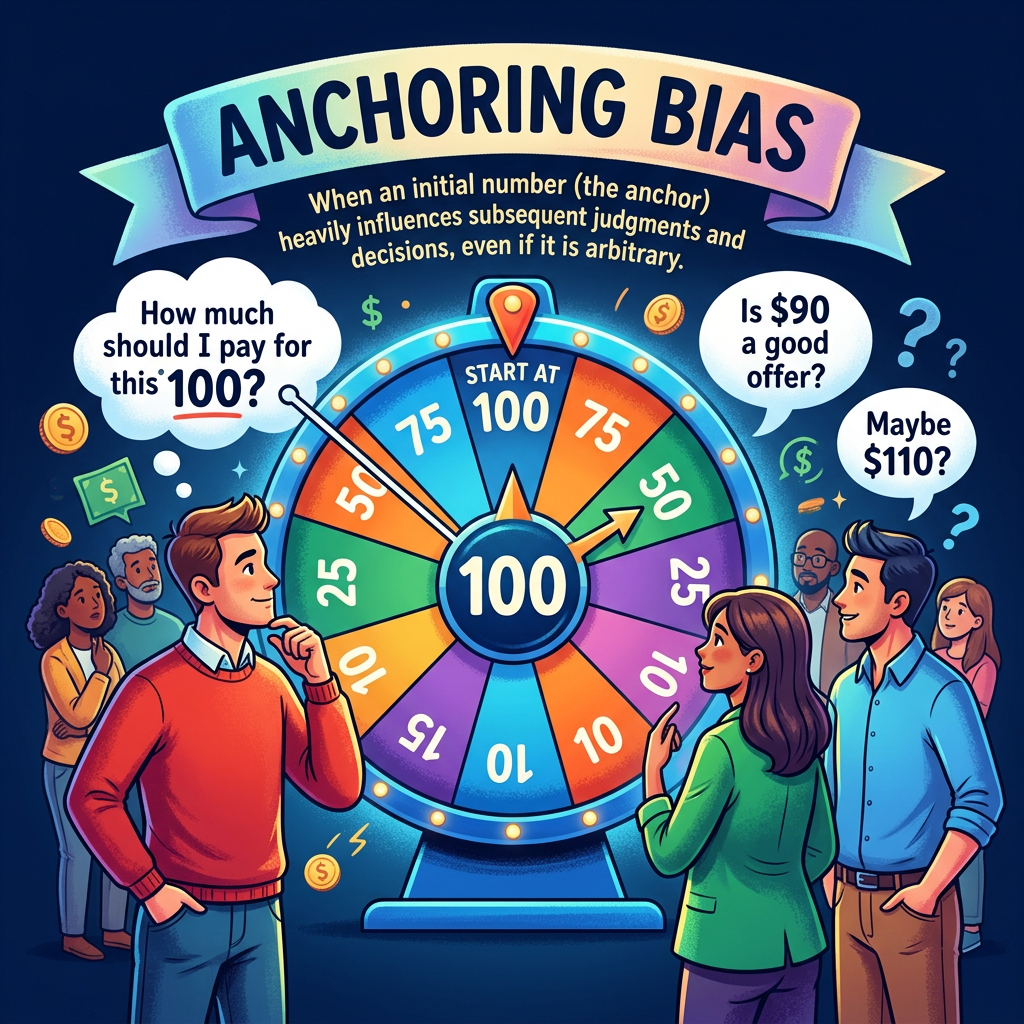
Someone says a number out loud, a budget figure, a timeline, a rough guess, and from that instant your own estimate is quietly bent toward it. Not because the number was correct. Often it was arbitrary, sometimes obviously so, and you knew it. Yet it moved you anyway. This is anchoring, and it is one…
-
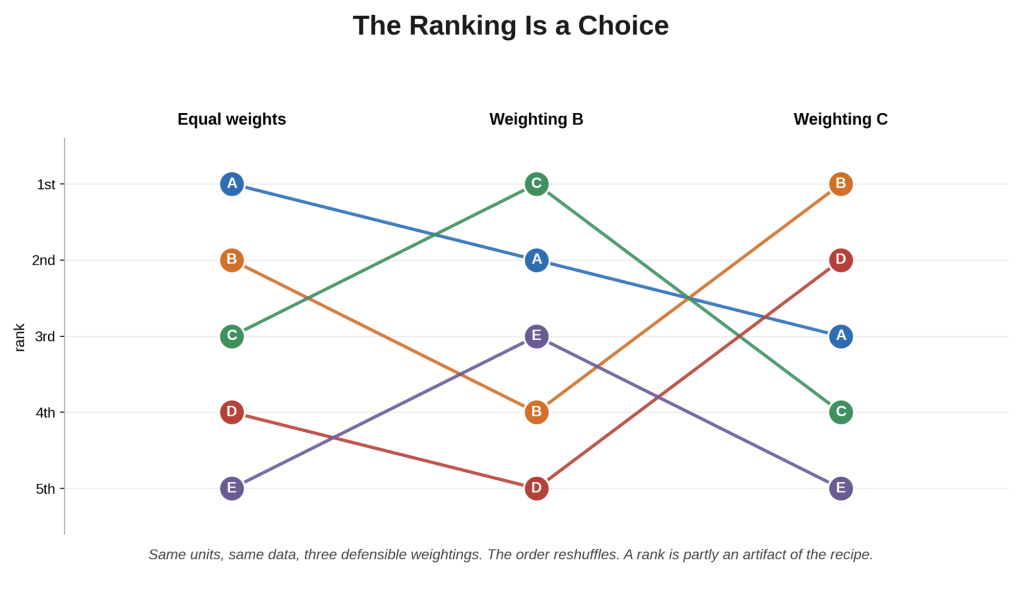
A single number that ranks things, states by vulnerability, hospitals by quality, programs by performance, carries enormous authority. It looks like a measurement, objective and settled. But a composite index is not a measurement the way a thermometer reading is. It is a construction, assembled through a chain of choices, and those choices, as much…
-

Picture a simple bar chart. Two bars, one taller than the other. Your eye settles the matter in an instant: this group is higher than that one. But the chart has withheld the single fact you need in order to trust that reading, which is how much each bar could have come out differently by…
-
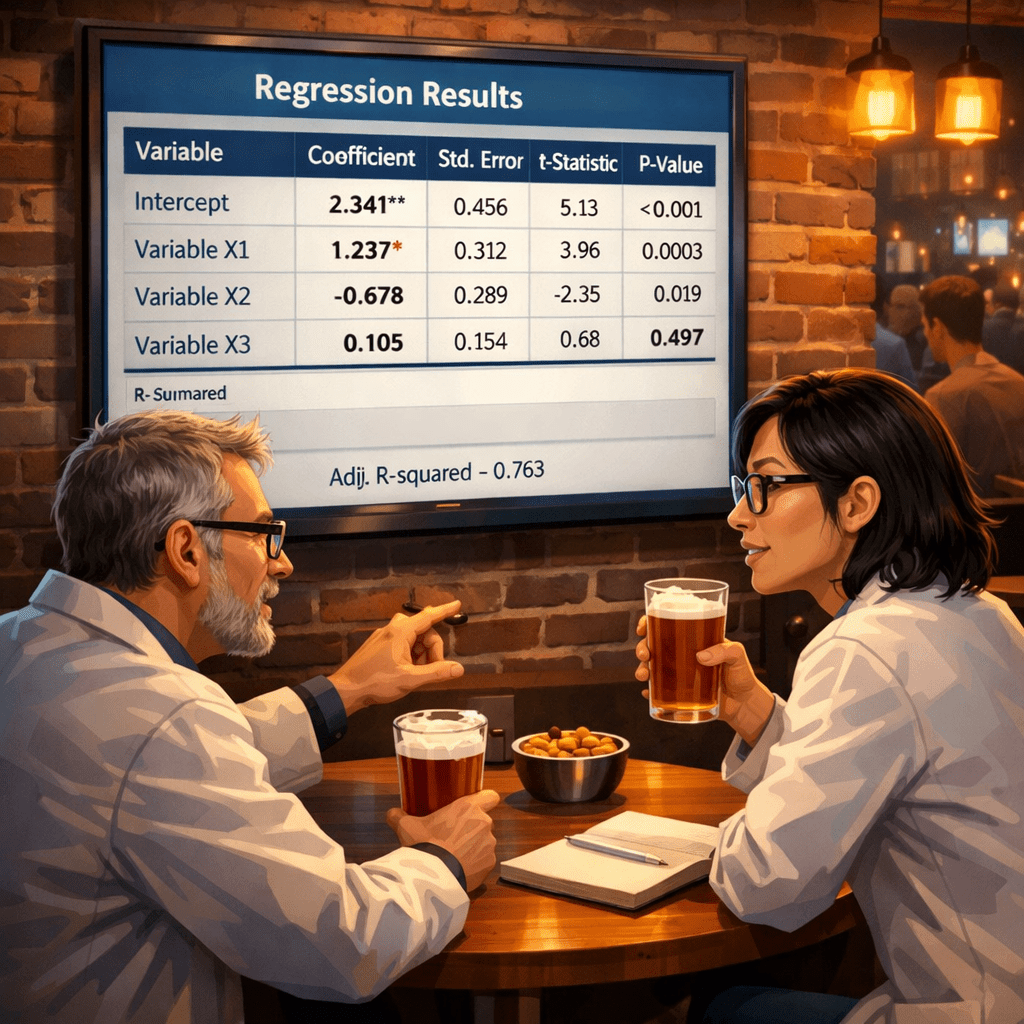
Open almost any study built on regression and you will find a table, often the second one, listing the outcome against a main variable and a row of controls, each with its own coefficient. The natural habit is to read down the column and treat every number as the effect of that variable. It is…
-
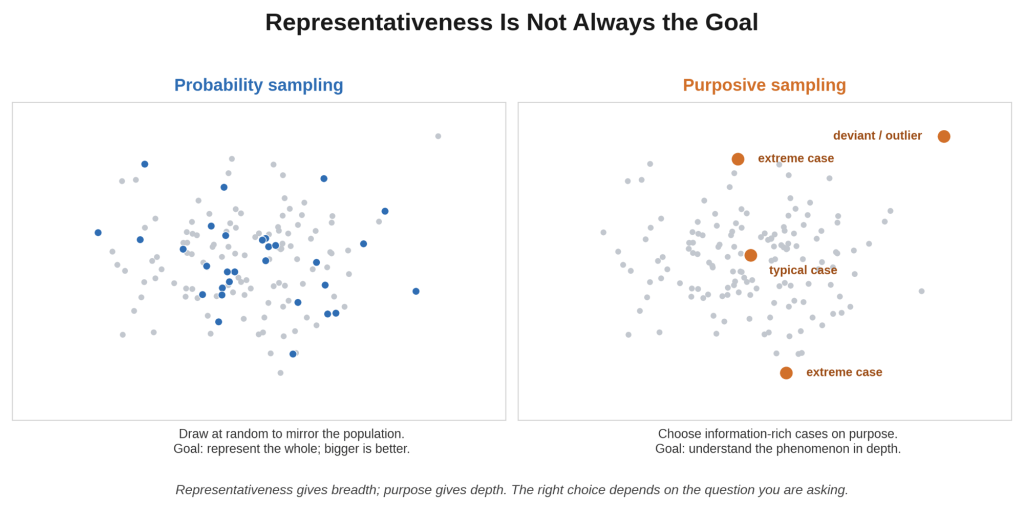
Ask most people how to choose a sample and they will reach for representativeness: draw at random, mirror the population, and bigger is better. For estimating a quantity in a population, that instinct is right. For a great deal of qualitative work, it is quietly wrong, and clinging to it leads people to dismiss good…
-
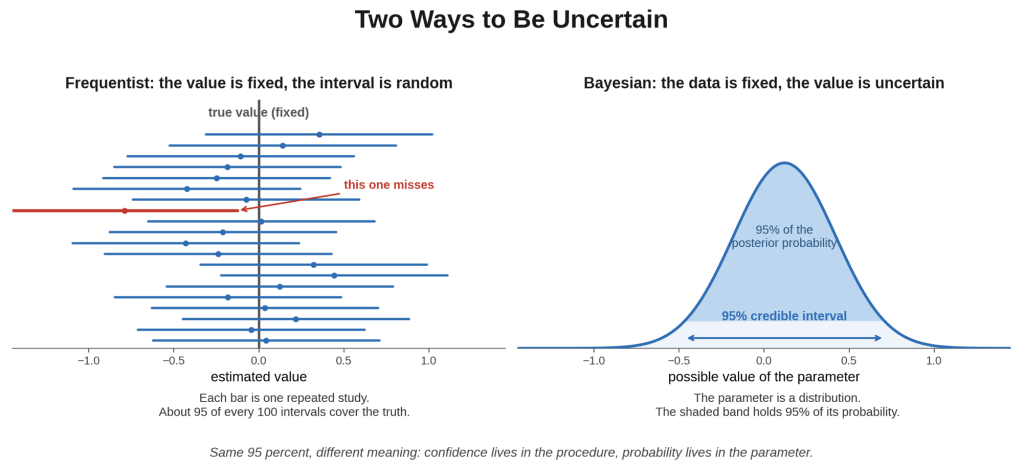
You calculate a 95 percent confidence interval and describe it the natural way: there is a 95 percent chance the true value lies inside. Almost everyone reads it like this, and almost everyone is wrong, not because the math failed but because the sentence answers a question the tool was never built to answer. Behind…
-
Most of evaluation assumes a program that holds still: you specify the model, set the goals, let it run, then judge whether it hit them. That works when the program is stable and well understood. But a great deal of real work is not like that. New initiatives are still finding their shape, complex efforts…

